My home is connected to the electricity grid through a 3-phase line, provided with 3 × 25A circuit breaker and a line tension of 127 V (star scheme). In other words, the tension between phases is of 220 V (triangle scheme) and the total power of the connection is of 9,5 kVA. A classical connection in the neighborhood.
Some years ago I have installed photovoltaic panels (in my garden, because the house is roughly East-West oriented, and there is very few shadow on a well-chosen place in the garden), of limited power (1,7 kVA). At that time photovoltaic technology was still expensive and on the other hand I didn’t want the production to exceed the consumption by so much at all the time (thus included in the summer). The daily (gross) production never comes above 10-12 kWh, the same for the (gross) consumption. Such level of photovoltaic power installation exists only in monophasic design, the 3-phase design is commonly not provided below 7kVA.
Now, I wanted to get insight in the electric flow from and to the grid, on a granularity of 15’, or finer, to capture the peak of power. This means that the measuring device must be able to cope with consumption (3-phase) and production (at least monophasic) and log the data on 15’ time basis (or finer) over a period that is as long as possible (and at least 1 week long).
Capturing the peak power is important in preparing the switch from the today Belgian energy consumption (kWh) based grid tariffs, to the power tariffs (erroneously called ‘capacity’ tariff) already announced for the near future. I’m aware capturing the peak of power would theoretically require a 20-60 milliseconds measurement, since some devices (like electric motors, rather all devices with a dominant inductive character) show transitory peaks that are 5 to 7 times their nominal power.
However most of the household electric appliances are of the resistive kind (oven, cooking plate, water warming) and the ones provided with a motor do not have a high power (the motor of the washing machine has a small power in comparison of the warming resistance one). No motor of an electric appliance in a house has a nominal power exceeding 1kW, unless you have installed a heat pump (for heating and/or cooling) or a significant well equipped workshop in the garage.
We must be aware that the power to take into account is the apparent power (the power that appears to the circuit breaker), which is expressed in kVA rather than in kW (which depicts the active power). Normally when you sink 1kW of active power through resistive device, the unavoidable inductance will bring 5 to 10% extra in the apparent power. Of course, we have to know whether the measuring equipment measures either the active or the apparent power. If we use a current clamp, we measure the apparent current, so that we don’t have to transform active power to apparent power. In the following we will thus use kW as well kVA, but without actual impact on the analysis.
Before achieving any measurement we already now that the peak power must be higher than the nominal power of the photovoltaic panels (rather the minimum between this power and the one of the DC‑AC converter connected to it). In my case thus 1,7 kVA. We have so a lower bound for the peak.
Another interesting thing is the ‘always on’ power. In a house you have devices you never switch off, like: internet router, TV decoder, TV (standby), alarm clock, alarm system, clock(s), light switch, transformer of the doorbell, …
However you usually not switch your fridge off, it does it by itself in cycli (depending on the suited inner temperature, the outer ambient temperature, the openings of the door and its contents) so that it does not come into account in the ‘never switched off’ devices list. Nightlight are, by definition, only on during the night and thus also not always on.
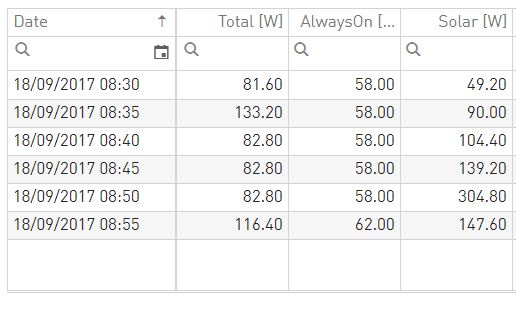
I’m mentioning these not exhaustive lists because you will be surprised of the power level reached by the ‘always on’ devices. At home, after 3 months of data logging, this level lays between 45 to 65 W, let’s take 60 W. This is the power of a classic standard incandescent bulb lamp of 60W, like the one we had in our desk lamp (now they have been replaced by their halogen or led illuminating equivalent). It is huge. The yearly related consumption is of 525 kWh, it is of the same order of magnitude of the most electricity consuming device at home over a year. So, how can I lower this level ?
This leads to the next point: the identification of the appliance responsible of each consumption pattern, as well as the allocation of its yearly consumption and impact on the peak of power. The goal is here to find the devices consuming much and draw a way of reducing their consumption.
Thus my goals are: measuring the peak of power, identifying the consumption of the most demanding appliances, allocate them their yearly consumption, point out the ones that should be replaced and enable the reduction the ‘always on’ consumption. These requirements imply the measurement and data logging equipment must be able to measure the power (3-phase in and out) and log the data over a long time, or provide an export to csv or Excel file for compilation and further analysis over a period of relevant length.
With these specifications, I searched for the suitable equipment, but only investigated a small amount of them. The offer is huge and the possibilities are very diverse, as well as the acquisition (and sometimes usage) prices. I didn’t want to spend several days, or still more, in evaluations, furthermore based on Internet presentations.
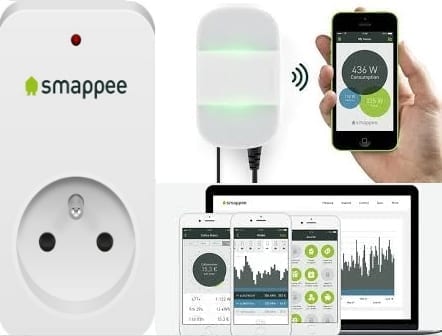
I have selected the Smappee. It was not the cheapest one but I contacted them easily and got the answers on my questions. I was thus confident in the company and in getting what I was looking for.
To be honest, the installation is not complicated (while 3-phase consumption and mono-phase production) and the equipment is able to measure the consumed and produced power on a 5’ time basis (thus power = energy consumed during 5’ divided by 5’), surely enough from my point of view. Monitoring on-line from home (wifi in house) and from anywhere (data in the cloud, accessible via phone and computer app). Export to Excel with the 5’ granularity on a weekly basis, on a daily granularity over months. Daily, monthly and yearly sums. Separated data for consumption and production. For all specifications and further details, see the site of the manufacturer.
The drawback is the consumption appliance identification. The Smappee claims to be able to identify the different appliances. Indeed it works when you must identify a motor (like the one of circulator in the heating system, the compressor of the fridge) from a microwave and from a resistive (heating) element, and also within the same class (motor, microwave, resistive) when the used power is different enough but not within the same class for appliance using the same, or very similar, level of power. For instance it is not able to differentiate a Nespresso machine (resistive heating element) neither from a cooking plate (with similar power) nor from an iron (steamer of the similar power).
In the package I also received a smart plug, but I have never used it till now. I think it will not help me in setting-up automatic appliance recognition, while it would help in analyzing the behavior of each device I would want (one by one).
This is a pity because the application gives also a rendering of the usage a daily, weekly, monthly clock diagram that is very easy to read and understand. It is a very interesting functionality, enabling you to identify, per appliance, the maximum of the power demand, its period of use (and dispersion) and its total consumption over a period. After a certain period, I have got the necessary experience to identify the appliances visually on the 5’ graphs. The systems enables setting-up a price for the consumption kWh (cost) as for the production (revenue).
Daily graph (in dark grey the gross consumption, in green the gross production, grid result = gross consumption – gross production, grid result is offtake if positive and injection if negative), 5’ (average) power value (energy [kWh] = power [kW] × 5 [min] / 60 [min], thus 3kW during 5’ results in 0,25 kWh):
 Weekly graph (same info as daily, but over previous or current week, day on which week start is configurable):
 All days energy graph (gross consumption and gross production energies, aggregated by day on all the days since the beginning of the data logging), green becomes darker when it covers grey parts, thus when production matches consumption (both aggregated on day level, thus not necessarily on 5’ basis):
 Excel (or csv) export over a self defined period (there are also predefined periods with power at 5’ granularity like: today, yesterday, this week, previous week; predefined periods with energy at daily granularity like: this month, previous month, last 30 days, all days; and an aggregation of energy at month level):
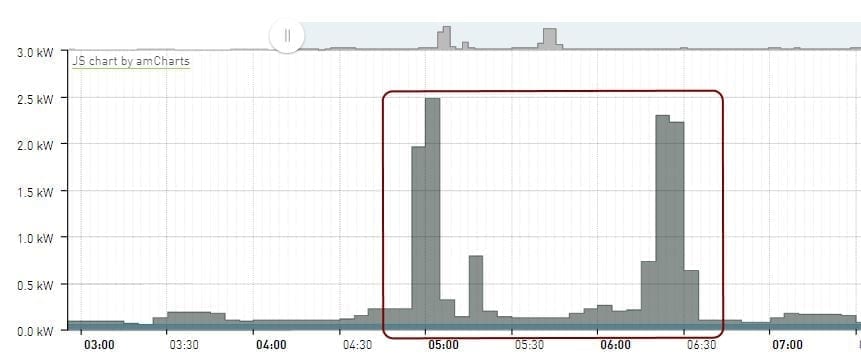
On a day I was not at home, I saw an atypical consumption in the early hours (around 5 AM), I recognized the dishwasher pattern. I called my son to be sure everything was O.K. He told me a stormy rain had awaken him, he went to the kitchen and by the way, he puts the last things in the dishwasher and launched it. Hereafter the pattern I recognized:
Pattern of the washing machine (a series of 3 cycli, in combination with the tumble dryer turning the previous cloth batch) cycli (3 red frames) and interference of tumble dryer (blue elliptic frame):
 Besides the total power of my house, I have also access to the peak on each phase. Over the analyzed period I can say that, when appliances are on, the equilibrium between the phases is nearly never reached (within any period a 15’). This is due to several elements and leads me to the conclusion that a real useful equilibrium can’t be realized, because the cabling is fixed and the use of the appliances are random (if you look at it at 15’ time window level). Thus also when the 3-phase appliances are cabled correctly, and the electrician took care of the distribution of them over the 3 phases, the result is not equilibrated in the reality of use. This situation can be reinforced by the solar panels, depending on their power and the phase on which they are connected to.
Collecting all these pieces of information , I have now a better view on my use of electricity: the peak of power I’m sinking does not exceed 5,5 kVA, the use of power is in reality not equilibrated over the 3 phases, my solar production is not optimally used, my ‘always on’ consumption is too high (roughly 500 kWh/year).
The action I will undertake are the following: assess the possibility to reach a real equilibrium of the power demand over the 3 phases or request a change of my connection in a monophasic one, research the ‘always on’ appliances and endeavor to reduce them as much as possible.


