Already since a couple of years distribution grid operators (DGO’s) are charging extra cost to the photovoltaic solar panels (PV) owners through the so called “Prosumer” tariff, in particular in Flanders.
DGO’s argued the compensation of the electricity offtaken in the winter by the production injected in the summer causes financial imbalances in detriment of the other grid end users (the citizens not having solar panels). A very popular but also populist sentence that we will analyse below.
But now, surfing on the wave of the communication success of the campaign directed against the prosumers, they will go further: they will oblige the prosumers to pay for (what they call) the gross-offtake, without remunerating them anything for the gross-injection (while the suppliers will be ‘encouraged’ to do so, but only for the energy – which represents no more than 25% of the bill, and nothing for the distribution and transport costs, which represent nearly 3 times as much).
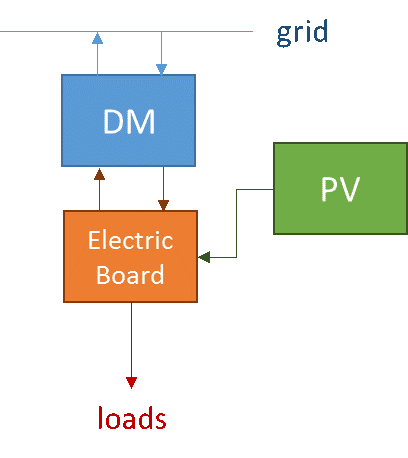
Let us first explain what the gross-offtake is and what the gross-injection is. To measure these quantities, a digital meter (DM) will be placed at the premise (house) of each prosumer and each of them will be charged (again an extra surcharge) for this meter (how much is not yet publicly available … probably because of the upset it will cause).
Now a DM will measure, during each 15’ interval, the energy exchanged with the grid, by summing up the electricity offtaken on one side (in 1 register) and the electricity injected on the other side (in another register). Imagine the situation:
So that, if the actual goal of applying the gross-offtake tariff is avoiding cross subsidisation from one group of citizens to another, then the DGO should remunerate the prosumers for the distribution & transport cost reduction provided by the prosumers to the other end users, to avoid a cross subsidisation from the prosumers group to the others. To estimate the related amount, let us build a simple but representative model for the electricity grid. This model does of course not perfectly reflect the actual grid, but it enables to calculate a good approximation of the cost reduction provided by the prosumers to the other grid users.
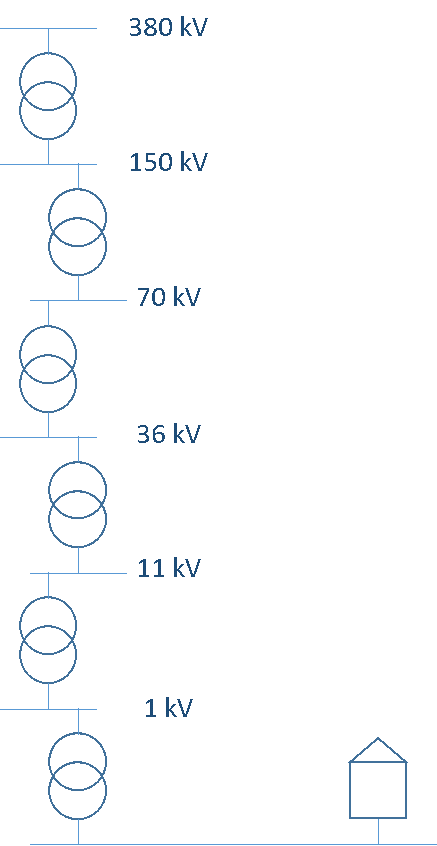
Our grid is made of 7 voltage layers, from the highest one (380 kV, thus 380.000 V), which is internationally interconnected, down to 230/380V (at the house level), through 150 kV, 70 kV, 36 kV, 11kV and 1kV (the cabin at the corner of the street).
At each level, there are some users connected. Let us calculate how much by level, by applying a geometric growth on the amount of connections, along the descending voltage levels. Knowing the amount of connections at 380kV and the total amount of connections (for the whole grid), we can calculate the (grow) factor, which is of around 8,7 (the ones interested to the calculation: see the Wikipedia page for geometric growth), leading to some 433k connections at 1kV level and 3,77M connections at 230/380V, for a total of around 4,3M connections. These figures are not exact, of course, but are a really good approximation of the reality.
 |
 |
 |
| Fig. 1 | Fig. 2 | Fig. 3 |
The grid losses, calculated by Elia, thus for the Elia grid (levels 380 kV -> 70 kV) are of 1,5%. This means that the electricity that flows from all the injection points on this grid till the offtake, through that part of the grid, undergoes a loss of 1,5% (in other words, for 1000 kWh of electricity injected, globally, only 985 kWh reach the offtake point).
Of course, a part of this electricity flows to 380 kV connected grid users, another part to 150 kV connected grid users … till the part exiting the Elia grid at 70 kV at the destination of the household customers (230/380V).
For the layers below 70 kV, if we suppose the grid (design) is optimized, the netlosses are nearly equal in each level. So that, knowing the total netlosses (Elia + DGO’s) over the whole grid (over a year) lays around 9,15% (yes nearly 10%, so much, awfull) of the offtaken electricity, we have a loss of 2% through each DGO level ((1 – 1,5%) x (1 – 2%)^4 = (1 – 9,15%)).
The injections of the solar panel go never further than the lowest level of the grid and the level just above. So assuming that the owner (of solar panels installation) consumes for herself only 1/3 of the produced energy, 2/3 being injected into the grid, with 200k installation in Belgium, having an average apparent power of 4,5 kVA and 1.000 equivalent hours of production, the total injected is of 600 GWh/year ( 200k x 4,5 k x 1.000 x 2/3 = 600G). These injections also undergo netlosses but only in the lowest level and in the level just above. Considering they uses the lowest level for 100% of the total injected (from any to any, till the entry of the level above) and 50% of the level above (from all entries to sourced users) because the total injection entering this level is far lower than the offtake in this level, we have losses of 3% (2% x 100% + 2% x 50%).
This means that, on the 9,15% of global losses, the solar panels get rid of 6,15% (9,15% – 3%), which are not to be paid by the whole group of users connected to the 2 concerned grid levels. These avoided losses (costs) represent 37 GWh/year (6,15% of 600GWh/year). With a total distribution + transport cost of 130€/MWh, this means roughly 5€/kVA per year (nearly 24€/year for a 4,5 kVA installation) should be paid to the prosumers.
This is first point, but there is still more, much more. But to go further, we have to know the grid costs are calculated as a post (snag mail) tariff within each voltage level and that the total grid cost applied to a user is the sum of the post tariffs for each level the electricity is flowing through to reach her. And we know only the total we pay (when looking at our annual bill).
To know the post tariff of the different layers, one could be tempted by analysing the tariffs of the DGO’s for the different (types of) users. Unfortunately, this can’t be achieved because one would have to know how much users are present in each tariff group and also the global mix of power, energy and day related components present in each of the numerous tariffs (please try by yourself: download the DGO tariffs from the websites of the regional regulators and see).
Furthermore the tariffs are strongly depending on the DGO, figures for same components are varying a lot from the one to the other (factor 2, yes 100% more, from the cheapest [Ores Mouscron] and the most expensive [Gaselwest], on a yearly basis total for a common household customer).
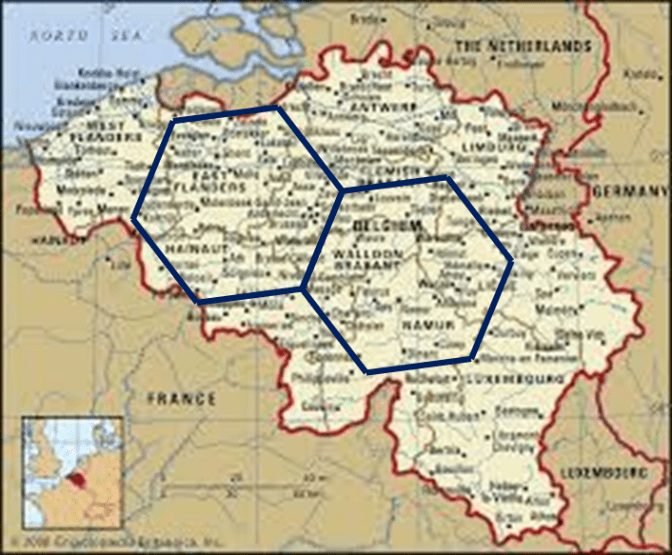
So we have to refine our model depicted in fig.1. In Belgium, there are 2 main loops at 380 kV, a basic mesh, which is further declined in a still narrowly meshed network each time we deepen one voltage level lower.
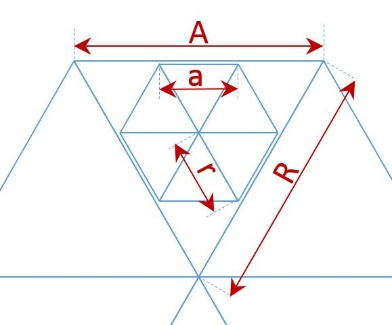
The model we will use is based on hexagonal meshes, popping down in smaller hexagonal ones, down to the lowest voltage level (fig. 2 and fig. 3. depict one loop of one layer as an hexagon, which is declined in 7 hexagons in the layer just below, fig. 3 enhance the fact some corners of the above layer are not declined below because of border effects).
We chose hexagonal kind mesh, for several (mathematical and topological) reasons, the main ones are that they provide a ‘complete pavement’ of a plan and that it approximates well a circle (each point on the circle being at the same distance from the center). We can discuss this point, but hexagonal kind meshes are largely used, also to design the cells in which our mobile phones are connected.
In this model, every (up level) hexagon (darken in fig. 2 & 3) is connected to 7 underlaying hexagons (it appears clearly in fig. 2). This count excludes the partial hexagons connected to the corners of the upper level hexagon, doing so we don’t take into account the equivalent of 2 underlaying hexagons (6 x 1/3), but this apparent absence is the way we will model the border effects (less or no users are connected at the extremities).
In Belgium we start with 2 hexagons:
Each time we pass from one (upper) level to another (lower) level, the electricity flows through a transformer (in reality, several, but we model all them as a big one), undergoing transformation losses (called iron losses or Foucault losses) and every distance of cables the electricity flows through causes also losses (called copper loss or Ohmic losses).
In an optimized grid (what we suppose matches merely the reality, otherwise why isn’t it so ?), both types of losses are balanced (each kind, transformation & distance, represents roughly 50% of the total).
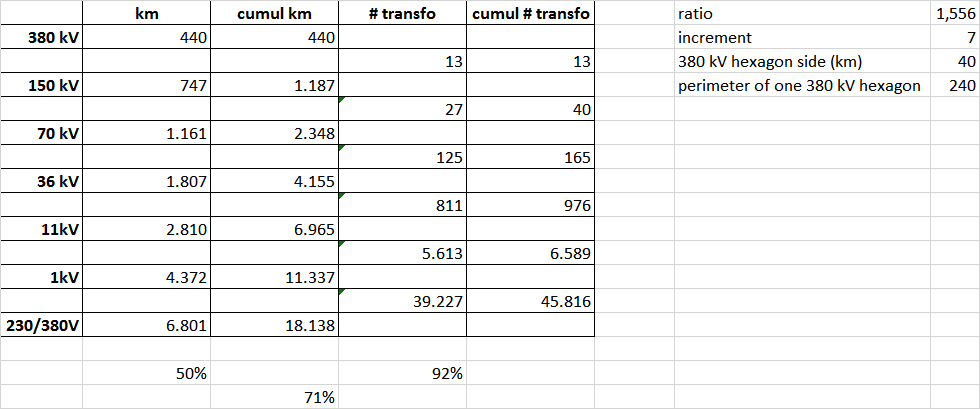
Starting with 2 hexagons at 380 kV and taking into account they have 1 side in common and that 2 (out of the 10) corners only tells only for 50% (less customers present at the extremities), we have 13 transfo’s (380 kV/150 kV) and 440 km (11 x 40 km) of cables for the 2 loops at 380 kV. So at 150 kV we have a total of 27 transfo’s (13 + 2x 7, 13 from 380 kV level and 2 loops, thus 2 x 7 transfo’s 150 kV/70 kV) and 747 km of cables (2 x 240 x 28/18 = 747), and so on till the 230/380V level.
Of course, the absolute values obtained by the computation on the model may not be taken as valid (e.g. because there are doubles for securization, fault tolerancy, redundancy, …), neither for the amounts of transfo’s nor for the cables lengths, but what tells are the ratios, more precisely the ratio of the sum of the figures of the lowest level + 50% of the ones for the level just above, on the total sum through all levels.
We get so a ratio of 92% of the total transfo’s cost and 50% of the total cable cost. Still relying on an optimized grid where the transfo’s and cable costs are in balance (for the losses, thus also the usage), we can say that the cost related to these ratios are 71% (92% x 50% + 50% x 50% = 71%). The savings for the related distribution is thus the difference to 100%, i.e. 29%. This means that the energy injected into the grid by the prosumers generates a saving of 29% on this quantity of energy, for the other grid users.
Using an average grid cost of 110€/MWh at distribution level and 20€/MWh at transport level (3 upper layers), for a total of 130€/MWh (VAT exclusive), we have: 100% saving on the transport = 20€/MWh and the remaining 17,7 €/MWh (130 x 0,29 – 20) on the distribution, for a total of 37,7 €/MWh. Thus 37,7 € savings for the other grid users, for each MWh of electricity injected into the grid by the prosumers.
This represents, still based on 2/3 of the solar production injected into the grid, 25 €/kVA by year (17,7 x 2/3 x kVA + 20 x 2/3 x kVA), which outcomes to 113 €/year for a 4,5 kVA installation.
If we want to keep the line on ‘one group of end users will not support the charge for the other ones, which is the argument used by the DGO’s to apply a prosumer tariff (now rather a gross-offtake tariff), there is no reason for not granting the prosumers the savings they generate at distribution and transport cost level for the other grid users.
Further, since Belgium has to fulfil its engagement in CO2 reduction and the solar panels contribute to a substantial part of this reduction, these savings should be remunerated too. Using the publicly claimed figure of 456g of CO2 by produced kWh, emitted the Belgian mix of power stations, and a market price of 55€/tCO2, the injected energy, by the prosumers, into the grid generates savings of 16,7 €/kVA by year (0,456 x 2/3 x kVA x 1000 x 55/1000).
Adding all the elements, by kVA and year, we have: 25€ (distribution and transport cost savings) + 17€ (reduction in CO2 emission) = 42€/kVA by year. The 5€ of the grid losses avoidance, put in evidence at the beginning, are already present in the total grid cost we used.
When one will apply a prosumer tariff (via gross-offtake of kVA driven), which is globally equivalent to a full grid cost for a consumption volume equal to the whole gross-injection volume (around 90€/kVA by year), the cost reduction of 42€/kVA by year (+21% VAT, thus nearly 51€/kVA by year) must be granted to the prosumers to ensure the respect of the principle that ‘one group of end users will not support the charge for the other ones’.
In other words, when a prosumer tariff (of any of both types) is applied, each prosumer should thus be granted, on a yearly basis, a discount of 51€/kVA (or 51€ by injected MWh in case of gross-offtake tariff) on the distribution and transport costs, or the prosumer tariff should be 50% lower than what is applied as of today.


