We hear from time to time that the charging of electric vehicles (EV) will require huge investments to avoid overloading the grid. This is actually not true and from far. In a previous article (see https://edenergy.be/archives/1364?lang=en), the reference consumption of an EV has been established around 15 kWh/100km. With a daily driven distance remaining between 15 – 60 km, figuring an average of 40km and a related consumption of 6 kWh, the existing grid can surely afford the smart charging of at least 2.000.000 EV’s.
On the consumption/demand side, an annual average mileage of 15.000 km (Febiac: 14.999 km/year in 2016, with a trend of -1% by year) comes to an average of less than 42 km/day, thus 6 kWh of electricity by day (or 2.200 kWh/year, equivalent to 2/3 of a typical family household yearly consumption).
On the grid side, we have to distinguish the ‘last mile’, from (downwards) the transformer station to the end user (dwelling, commerce, industry) and upwards the transformer station (till the 380kV grid managed by the TSO).
Downwards the transformer station, the wires are sized to afford the max power, secured by the power breaker just before each meter. The breaker limit, commonly 25-40A (monophasic), lays (much) higher than necessary to charge smartly EV’s (see further).
Beyond, when the wires were laid, they were oversized, to take into account the foreseen growth (around a linear 3% by year) of the demand over 30 years (amortization period), thus roughly with 90%. Whilst, the consumption shows over de 5-10 last years a decrease (around a linear -1% by year), bringing the oversize to 120% over 30 years.
Now, some wires were placed a long time ago, others recently, we can thus consider an average ageing of 15 years, corresponding to a 50-60% oversize. So the ‘last mile’ part of the grid is not constraining and we have only to examine the grid load upwards the transformer station to assess a possible overload.
For grid data, the most recent year for which data are completely available has been used: 2018. The daily average domestic use of electricity lays around 10 kWh (8,3 to 12,5), the related power demand showing variations along the hours of the days and the days of weeks, public holiday on weekday being similar to a Sunday, Winter-peak/Summer-deep ratio being about 1,5. The curves below depict the typical domestic load by weekday on the grid (upwards), in reduced unit, by quarter of hour.
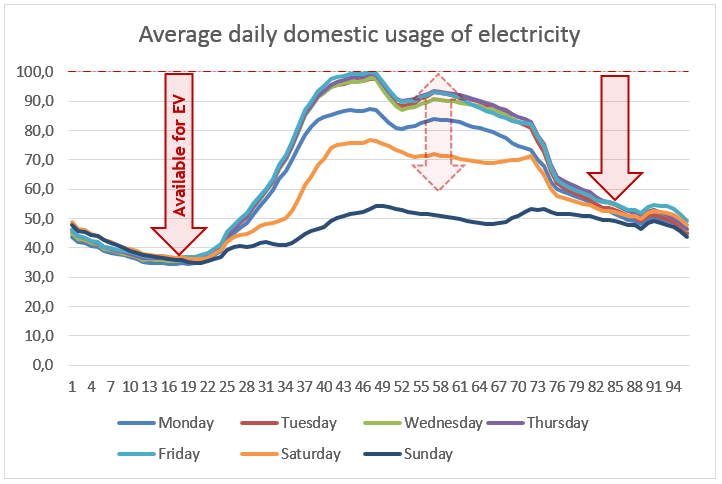
Of course they are the result of statistical stacking of groups of dwellings. But it is precisely what the grid must supply, till downto the distribution transformer station at the corner of the street. So we can use them here as reference domestic consumption profiles.
If we take the day during which the consumption has been the highest (sum over 24h, red+blue area in the graph below), the area above it, till the (100%) maximum (max_line), represents what is always available for EV charging (bright green area). The blue area is the day during which the consumption has been the lowest, represents what is never available. The red area is available on some days, in function of the day consumption for each considered day. Practically, a large part of the red area is available on most of the days (see further). The light green area is the probable ‘reserve’ (strip between 150% and 100%), due to the grid oversizing. This ‘reserve’ amounts nearly the same daily volume as the bright green area, thus roughly doubling it. In a more conservative approach we could only use 50% of this ‘reserve’ (thus between 125% and 100%), if necessary.
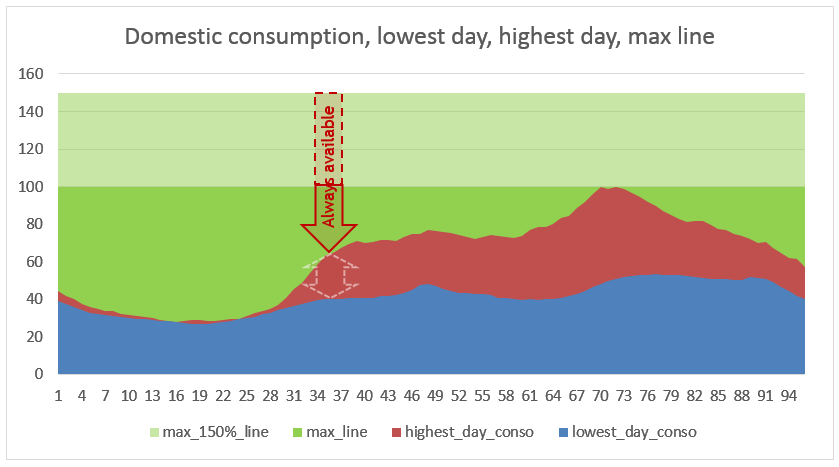
But the grid must also supply other kinds of offtakes (commercials, industrials, …), each group showing different behaviours, even when aggregated. The Belgian net aggregation (all types of demand taken into account) is observed at Elia level (on which all DGO’s are connected).
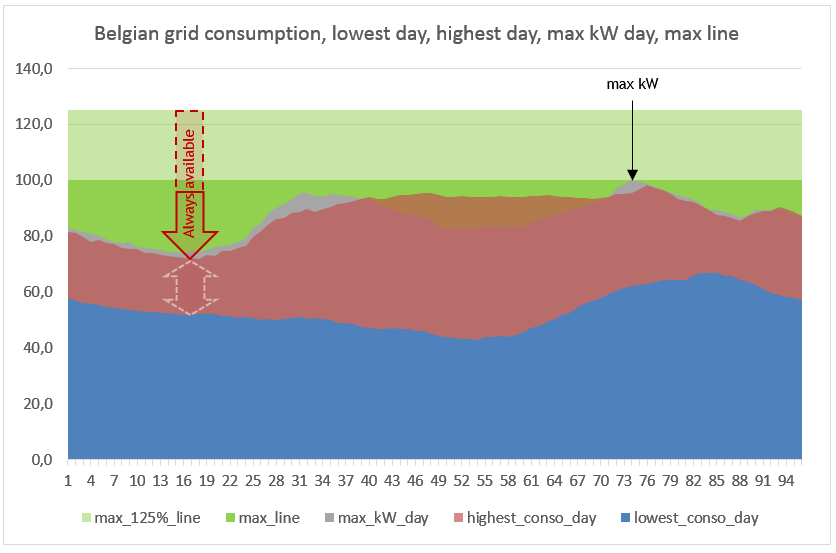
At Elia level, we assume an extra security marge to enable cross European security measures, which do not apply at distribution grid level, so that a lower part of the oversize could be used, we limited to 25% (vs. 50% at distribution grid level).
The same colour code has been applied as for the domestic consumption. At Belgian level, the day during which the highest demand (i.e. wherein the max power demand qh occurs), grey area, is not the day during which the consumption (24h) is the highest (red+blue area), however the max power demand still (of course) defines the max_line. The bright and light green area depict, in daily energy, what is always available for EV charging, respectively without and with the use of a reserve of 25%. The red area is (again) available, in function of the day consumption for each considered day.
This graph highlights the energy, as daily sum, but the grid must be in balance during each qh of the year, so for each day in the year we have to examine the max power demand during each time interval of 15’ (qh), and also the min power demand, knowing that the min for a qh does not necessarily occur in the same day as the max qh does. These 2 element are thus not relevant for our analysis.
All the graph show that, without changing anything on the existing physical grid (wires, transformation station, securities, …), a large amount of energy is available every day for EV charging, so that the grid can afford a large amount of EV’s. In addition, the max power observed, at Elia level in 2018, was nearly 10% under the maximum observed during the 5 most recent years.
Today, common domestic charging poles are modulating the delivered power to the EV they charge, configured to never exceed a maximum (e.g. 3,7 kW, thus 16A under 230V monophasic, or 7,4 kW/32A), using the remaining available power, laying between the usage in the dwelling and this maximum. Of course, when this power dives below the minimum defined by the car (manufacturer) to load, the charging pauses. The charger monitors the available power continuously, so that when the average of the available power exceeds this bottom line threshold during a qh (2,3 kW, thus 10A), the EV charges automatically for the related difference in energy.
Further, the EV’s (even the cheapest ones) are equipped with an app enabling the owner to configure the time window/pattern within which the charging can occur (e.g. between 02:00 and 06:00 on the weekday and around the clock during the week-end). Pausing/resuming this configuration is literally achieved on a finger tick (e.g. for punctual charge). The same apply for common domestic charging poles.
Now, to quantify the amount of EV’s the grid can afford, we must use absolute values (instead of relative ones).
The figures in the table below are obtained applying the following observed values and rules:
- max demand power observed in 2018 (at Elia level): 12.465.240 kW, thus without using any reserve
- EV’s are on the road during an average 2h/day , thus the max demand power is only useable for charging during 22h/day
- no charging if the available power falls below the bottom line for 1.000 EV’s, thus 2,3 MW, this corresponds to adding 2,3 MW to the observed demand (reducing the available power for charging)
- available power = difference between the max demand power and the (extended with 2,3 MW) observed demand
- available energy: translation of this power (curve), the (reduced by 2,3 MW) bright green area presented above, in absolute values
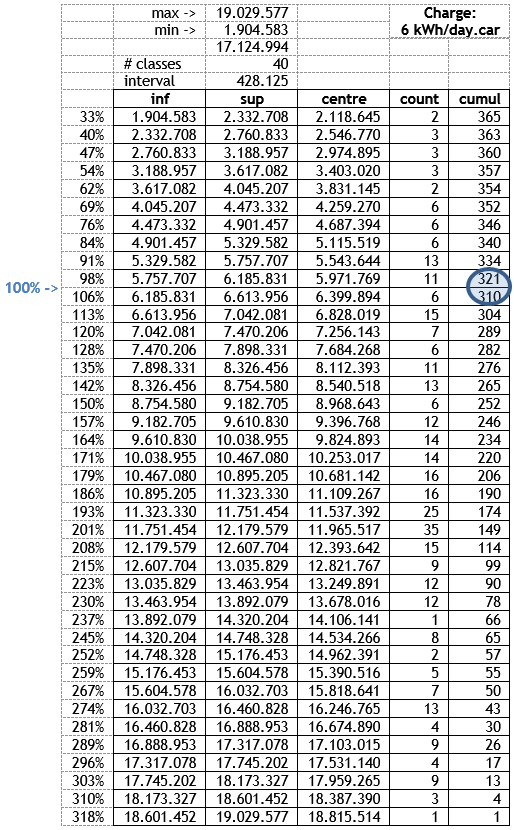
In this histogram table, the following elements meaning are:
- ‘Charge: 6 kWh/day.car’: average necessary daily charging for an EV = 6 kWh
- max: the maximal amount of EV’s that can be charged (during the lowest consumption day), 19.029.577 EV’s
- min: the minimal amount of EV’s that can be charged (during the highest consumption day), 1.904.583 EV’s
- # classes: the amount of buckets used, 10 would be to coarse, 100 to long to present here, thus 40
- interval: bucket size, the amount of EV’s over which each class spans (difference between sup and inf)
- inf: lower bound of each class interval, from .. EV’s
- sup: upper bound of each class interval, to .. EV’s
- centre: the amount of EV’s representing the centre of the interval (i.e. [sup + inf]/2)
- count: the amount of days where the amount of EV’s that can be charged lays between inf and sup
- cumul: the amount of days during which at least the inf amount of EV’s can be charged, 365 meaning during the all year
The % column on the left, is the ratio of inf/total_mount_of_personal_cars (5.853.782 in August 2018, according to Statbel).
The first line of table tells the following: during the highest consumption day, the today existing grid can afford 1.904.583 charges of 6kWh, spread over 22h along the day; only 2 days in the year impose this limitation; this amount of EV charging can occur 365 days in a year. Do not forget this figure does not include the use of any part of the existing reserve.
If the grid must afford, right now in once, the charging of the 5.853.782 EV’s, thus 100% in leftmost column of the table (thus between the 98% and 106% lines), it would be able to do so during 310 to 321 days of the year.
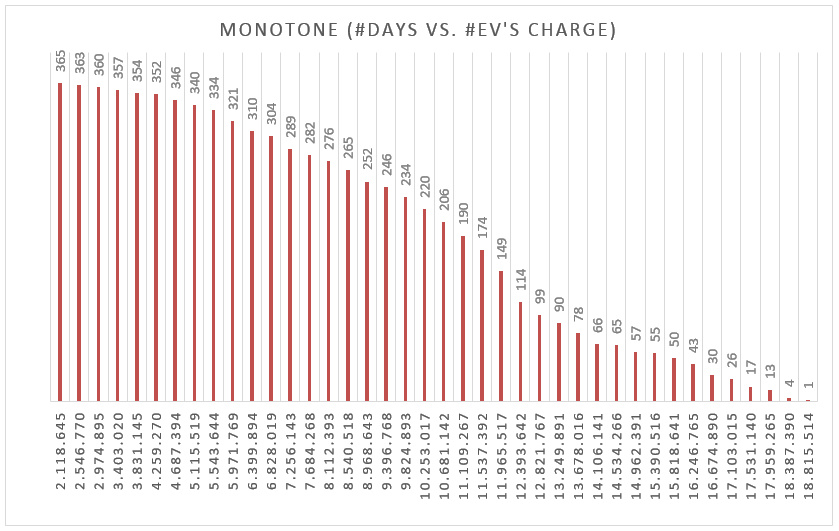
Today, there are about 10.000 EV’s in Belgium. The car renewing period is above 5 years, and the most optimistic previsions do not exceed 1.000.000 EV’s in Belgium before 2030. During this time interval, the global electricity consumption should have substantially decreased, freeing-up more grid power for still more EV’s than calculated now.
Smart charging, thus the use of the remaining grid available power, to charge the EV’s at every moment of the day, is thus possible, already as of today, for 2.000.000 to 4.000.000 EV’s.
Empowering the use of the grid over the whole day will require to enable the charging during the entire day, across the country. This can be achieved by deploying very simple 16A (3,7 kW) ‘secured’ plugs along the streets, tapped onto the existing grid wires (e.g. in the public lighting poles). The EV charging can then be modulated vs the max_line, and furthermore, the EV could be used for grid regulation, provided a fair agreement between grid and owners. Faster chargers could be installed for long drivers or punctual uses, by private companies, where (economically) suitable.
The EV will thus rather enable to optimize the grid investment (already made as to plan in the future) than overload it. Since this optimization (more selling for the same investment) will benefit to the grid operator and (via tariffs reduction) to all grid users (the entire society thus), the EV owners would better be granted a discount/incentive on their grid connection and grid usage. This would help citizens to make the investment in EV and reduce strongly our environmental footprint for the transportation (see previous article: https://edenergy.be/archives/1364?lang=en).


